In this paper, different glass-based solutions to solve indoor connectivity problems are compared through simulations and measurements, and the implications of differences between technologies are explained.
Analysis of the total transmitted power through glass panes and scattering patterns is provided at the 3.5 GHz frequency range, and field measurements in an operational 5G network are presented.
The study suggests that from the end user viewpoint the total transmitted power and the beamwidth in the horizontal plane are the fundamental properties to be characterized in signal transparent construction supplies.
Introduction
On the eve of the fifth generation of cellular wireless (5G), signal attenuation by low-E glasses in combination of other construction supplies is becoming a limiting factor for the full potential of the new technologies.
The paramount importance of low attenuation for wireless connectivity is seen from Fig.1, which shows measurements of how the performance of a wireless terminal is directly dependent on the strength of the received signal.
Fig.1a and Fig1b show the dependency of the download and upload speed of a commercial wireless 5G router on the received signal strength, respectively.
Fig.1c, on the other hand, shows the Signal-to-Noise Ratio (SNR) dependency of a 4G and 5G connection on the signal strength, which is a primary measure for the reachable connection speed. Similar dependency between the performance and connection strength can be established for any wireless device.
Indoor connectivity issues may cause unreliable connections, dropping calls, or reduced connection speeds. Mainly all due to the fact that the devices are operating too close to their sensitivity levels due to the weak signal.
The degradation of a wireless connection indoors due to the building envelope attenuation is a problem for any wireless device.
However, reduction in glass attenuation may be used to provide recovery efficiency for the indoor signal strength by aiming to maintain the indoor signal strengths well above the sensitivity levels of the wireless devices.
In this paper two different glass-based solutions for envelope attenuation reduction are compared through simulations and measurements, and the implications of differences between technologies are explained.
Frequency-selective-surfaces (FSS), i.e. two-dimensional bandpass filters, have been a go-to-solution for the glass industry [1]-[3]. Therefore, the first analyzed solution is a typical FSS grid.
The second solution to be analyzed is an array of slot antennas with enhanced horizontal beamwidth. The differences of the solutions are analyzed at the 3.5 GHz frequency band, which will be the backbone of the future 5G network deployment.
The paper is structured as follows. First, Section 2 presents the structures and the analysis of the power flow through different structures. Secondly, Section 3 introduces scattering pattern analysis in form of Radar Cross Sections, and lastly, Section 4 presents measurements of the different solutions, both in an anechoic chamber and in a 5G field test.
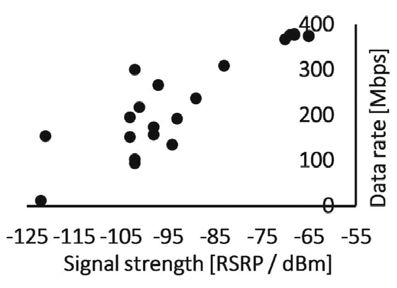
Fig. 1a. Measured download speed of a 5G terminal vs. received signal strength in a 3.5 GHz non-standalone (NSA) Time Division Duplex (TDD) network with 50 MHz bandwidth
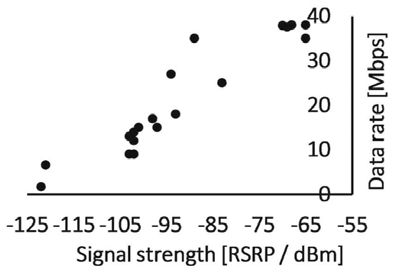
Fig. 1b. Measured upload speed of a 5G terminal vs. received signal strength in the 3.5 GHz TDD NSA network
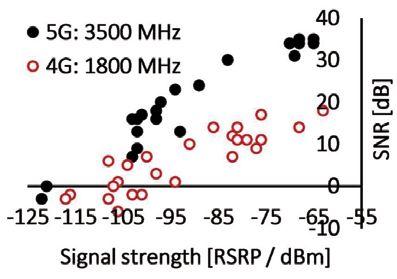
Fig.1c. Measured Signal-to-Noise Ratio in 4G and 5G network vs. received signal strength. Measurements were made in Finland during January 2019
Flow of electromagnetic energy through glass pane
Fig. 2 shows the structures that were simulated during this study. The left side shows a metal panel with an aperture in the middle. The aperture was used as the reference for other results.
Both open aperture and aperture with uncoated float glass were studied. The structure in the middle shows a commonly known FSS grid on the coating with 10mm unit cell size. The structure on the right shows a coated glass panel, where a slot antenna array is formed on the conductive coating layer.
Both the FSS and the slot antenna were simulated first using Perfect Electric Conductor (PEC) coating, and this was followed by replacing the coating with a conductive layer having a surface resistance of 5 Ω/square. For these simulations, the glass pane was modeled using permittivity of 4.6 and loss tangent of 0.0005. A thickness of 4 mm was used for the glass pane.
Fig. 3 shows how these different structures distribute wireless energy as the wave penetrates the aperture in the wall. The time domain simulations were carried out using the T-solver of CST Microwave Studio, which is based on Finite Integration Technique (FIT).
The simulations show how both the aperture with uncoated float glass and coated glass with FSS grid aim the 3.5 GHz signal energy to a narrow beam with a high directivity, whereas the slot antenna array spreads the energy in an omnidirectional pattern.
When the full structure is taken into account, the geometry of the aperture is seen to affect the scattering pattern of the transmitted wave. In order to compare such different behavior of different solutions, there is first a need to characterize the total efficiency of the solutions, namely, by integrating the full transmitted power through the glass.
Typical FSS design and analysis methods assume infinite 2D lattice, and both the incident and transmitted waves are treated as plane waves.
This assumption of infinity needs to be broken, and the effects of both the geometry and glass pane losses has to be taken into account separately.
Fig. 4 shows an illustration of the electromagnetic energy flow through an isolated aperture. An incident wave comprises an intensity (Si) as it illuminates the surface of the glass pane within the aperture.
The aperture has, in addition to the physical area, an effective receiving area that is related to the directivity of the aperture as a function of the incident angle.
The total power received from the incident space is delivered to the other side of the aperture, and this is reduced by an amount of loss in the aperture. The main sources of loss are caused by material loss, reflection, and aperture field taper.
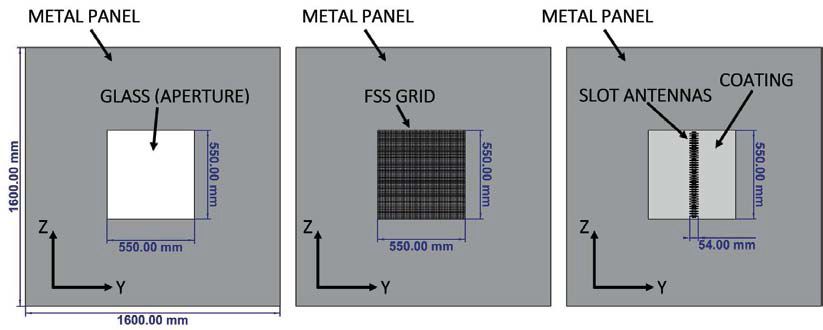
Fig. 2. Simulated structures. Left: Aperture for float glass and open aperture simulations (case no attenuation). Middle: Aperture filled with FSS grid on a coated glass (traditional solution). Right: Aperture filled with coated glass, and slot antennas arranged on the coating (alternative solution).
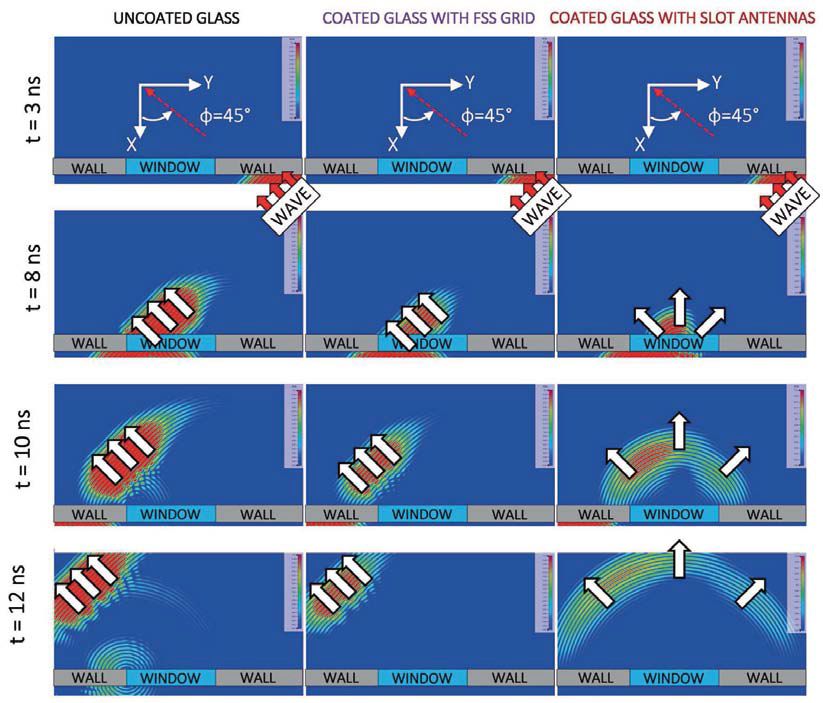
Fig. 4. Glass characterization based on 1) integration of the total power over hemisphere, and 2) evaluation of the scattering pattern using bistatic radar cross section
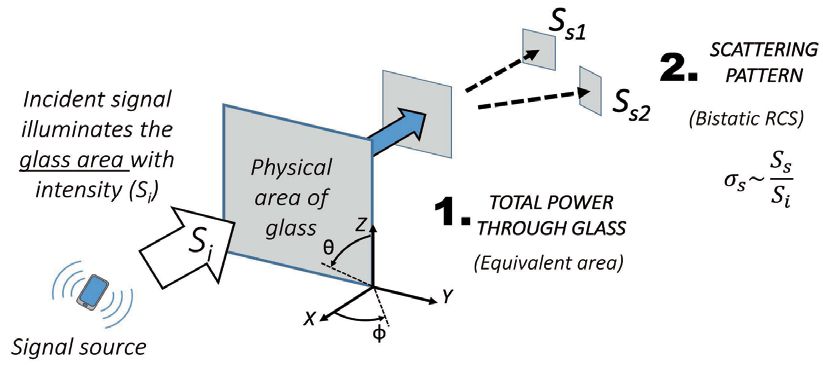
Fig. 3. FIT-simulated impulse response of an open window (left), FSS grid (middle), and slot antennas (right) for a modulated 3.5 GHz signal
(...)
Due to the presence of loss, the transmitted power through the aperture is always smaller than the received power. Furthermore, as the transmitted signal scatters differently with different solutions, using the effective capture area becomes unworthy in power comparisons, because it is dependent on the transmitted angle and directivity.
A more feasible approach is the determination of the total transmitted power through the aperture. This is done by integrating the transmitted signal intensity over the full hemisphere of the transmitted space. In the coordinates shown in Fig. 4, this means the space of the negative X-axis.
By using the total transmitted power, it is possible to relate the efficiency of different solutions to equivalent aperture areas, meaning the surface area of an equivalent open aperture in the wall that delivers the same amount of total power than the structure being characterized. This approach would make the comparison independent of the scattering direction.
Fig. 5 shows the computation of the total power through an open aperture, float glass, coated glass with FSS grid, and coated glass with slot antenna array. The simulations are performed both without conductor loss (PEC), and with lossy coatings, and with direct and sideways incident wave.
The Finite Element Method (FEM) -based F-solver of CST Microwave Studio was used for these simulations. From the total power point of view, the compared structures are on par. The simulations were carried out in vertical polarization.
Scattering patterns of different solutions
The second phase in characterizing different solutions comprises the analysis how the signal is scattered. Radar Cross Section (RCS) [4] is well known from the radar technology when the scattering of signals from physical objects are analyzed.
Bistatic RCS becomes usable in the analysis of glass panes, since the incident signal and scattered, or re-radiated signal are typically observed at different sides of the glass pane.
Bistatic RCS shows the scattered signal intensity in any direction for an incident signal that arrives from a given direction.
Bistatic RCS becomes particularly usable in the analysis of facades due to the fact that building walls are stationary, and the majority of outside base stations locate in the horizon.
In mobile transparent glass solutions, the bistatic RCS shows how the signal energy is distributed over a space, and this can be translated into estimation of the coverage efficiency of different solutions.
Wide scattering angles become important when the location of the outside base stations are unknown, and also when the user movement indoors is random, as is the case in all practical applications.
Fig. 6a shows how different solutions scatter the signal energy when the signal arrives orthogonally with respect to the glass pane, and Fig. 6b shows the same results when the signal arrives in a 45° angle in the horizontal plane.
The radar cross sections of Fig. 6a and 6b show a clear difference between the FSS grid and the slot antenna array, as seen also from the time domain pulse behavior of Fig. 3.
What is remarkable is that the FSS, both with PEC and lossy coatings, show about 10 dB larger maximal RCS values than the slot antenna structures, which have more omnidirectional scattering patterns for the transmitted signal.
Also for the sideways incident wave, the FSS grid has similar directivity than the open aperture, whereas the slot antenna array shows omnidirectional scattering.
From the above, it becomes also clear that the conventional method of measuring the transmission loss with the transmitting and receiving antennas on adjacent sides of the glass pane and arranged for a direct ray measurement, becomes incongruous for comparing solutions with different beam shapes.
This is mainly due to the fact that the FSS aims most of the energy to the receiving antenna in said measurement setup, and the slot antenna array distributes the signal energy to the sides.
Fig. 7 illustrates how an aperture with high and low directivity illuminate the horizon. With equal transmitted powers through compared apertures, the aperture of high directivity (float glass and FSS grid) concentrates much of the signal power to a narrow solid angle, leading to higher maximal RCS.
In comparison, the aperture with low directivity spreads the same power to a larger solid angle, which in turn translates into lower re-radiated field intensity in a single direction. The exemplary figure illustrates the unknown location of the base stations in the horizon.
Fig. 8 shows the simulated RCS patterns of Fig 6a and 6b as a 2D map over the horizon. The upper images show the scattering map when the illuminating plane wave arrives from the direction of φ=0°, θ=90°, i.e. from the direction of the positive X-axis, and the lower images show the same when the illuminating plane wave arrives from the direction of φ=45°, θ=90°, i.e. sideways in the X-Y-plane, as in Fig. 3.
The power that is delivered to the horizon is integrated over an azimuth beam of 180° (φ=90°…270°), and elevation beam of 10° (θ=85°…95°).
From Fig. 8 it can be seen that with FSS grid, an azimuth beam of 20° covers 90% of all the power delivered to the horizon, and with the slot antenna array, the same solid angle contains 26% of the respective power.
The corresponding beamwidths for the 3dB RCS pattern are 8° for the FSS grid, and 80° for the slot antenna array. Also the open aperture has, against intuition, RCS beamwidth of 8°.
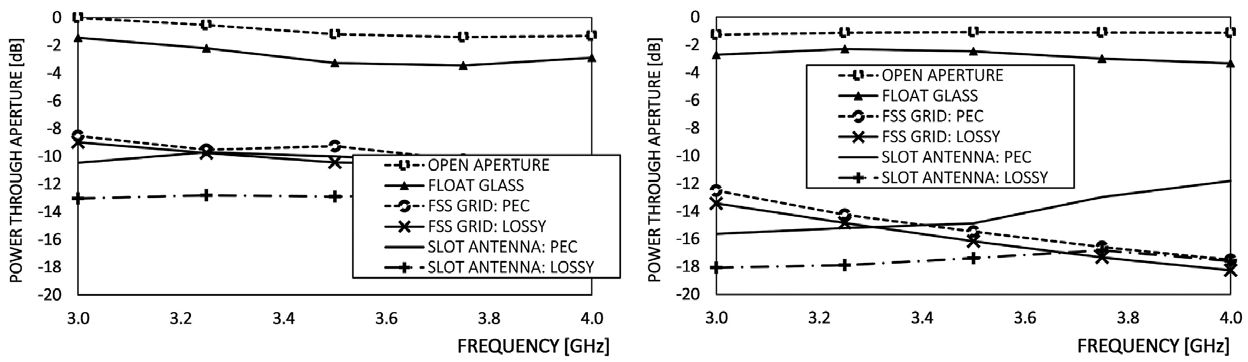
Fig. 5. Integration of the total transmitted power for directly incident (left) and sideways incident (right) wave at 45° incidence angle. All powers are referenced to the maximum value of the open aperture with direct incidence. With the lossy impedance model the slot antenna tuning was affected. The same dimensions were used for both the lossy and lossless antenna, and these dimensions were designed for the lossless case
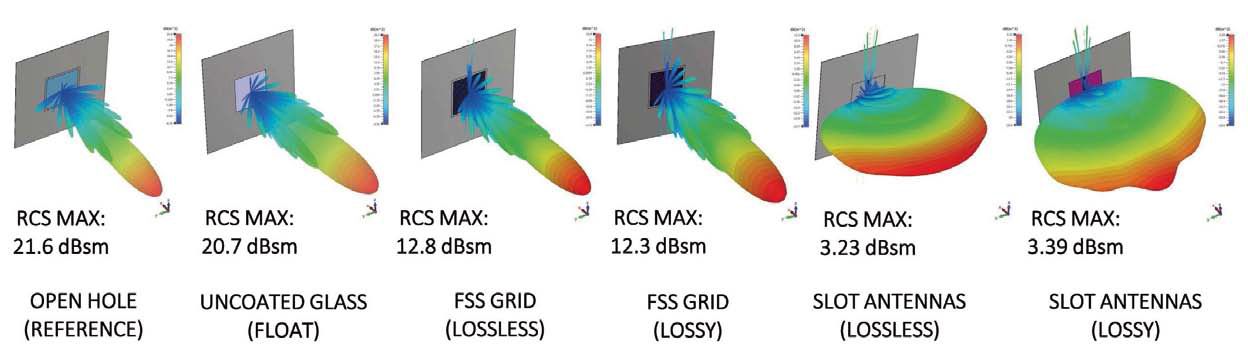
Fig. 6a. Isometric view of simulated scattering patterns for different structures with normally incident plane wave. The coated structures are simulated both with PEC and lossy coatings.
The lossy coating detunes the antenna array radiators slightly, and therefore the radiation pattern is not identical to that of the lossless case with same antenna dimensions
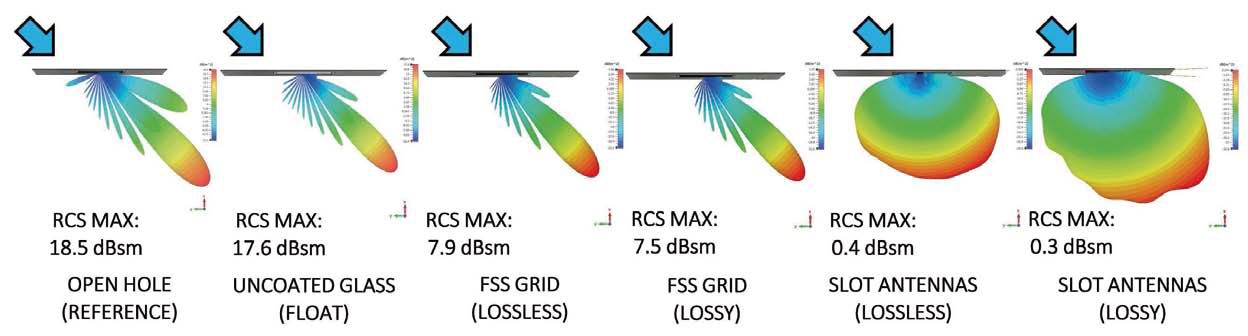
Fig. 6b. Top view of simulated scattering patterns for different structures with incident plane wave angle of 45°. The coated structures are simulated both with PEC and lossy coatings
Measurements with fabricated glass panes
Different glass panes were fabricated for measurements. The glass panes had dimensions of 60 cm x 60 cm, and a thickness of 6 mm. The FSS grid that was fabricated for testing had a unit cell size of 8 mm x 8 mm.
The slot antenna glass was redesigned for dual polarization because the same glasses were also tested in field trials, and the FSS grid is dual polarized due to the symmetry of the unit cell.
The glasses were first measured in an anechoic chamber using Vector Network Analyzer (VNA), and Fig. 9a shows the measurement setup. The transmitting antenna was feeding the measurement signal orthogonally to the glass pane. Two receiving antennas were used on the side of the transmitted signal. The S-parameter results at 3.5 GHz are reported here.
Here, label “S21” shows the S-parameter for the directly propagated ray. Label “S31” shows the S-parameter result for a bent ray that was measured at 45° angle, similarly to the simulations of the RCS patterns.
Fig. 9b shows the coated glass with slot antennas in the measurement setup. Also the transmitting antenna is visible. The measured glasses were installed in a metallic wall similarly to the setup seen in Fig. 2.
Fig. 9c shows a metal chamber that was built to test the same glass panes with an operational Time Division Duplex (TDD) 5G network. The interiors of the chamber were covered with microwave absorbers in order to attenuate unwanted reflections that would make the measurements extremely sensitive to the positioning of the 5G terminal. Due to the absorber interiors, the chamber behaves similarly to a large open space.
The 5G terminal that was used for the field measurements was a commercial wireless router. Due to the simplicity of the test setup, the tested signal was always arriving through the tested glass. Furthermore, as there was only one 5G base station nearby, there were no handovers during the measurements.
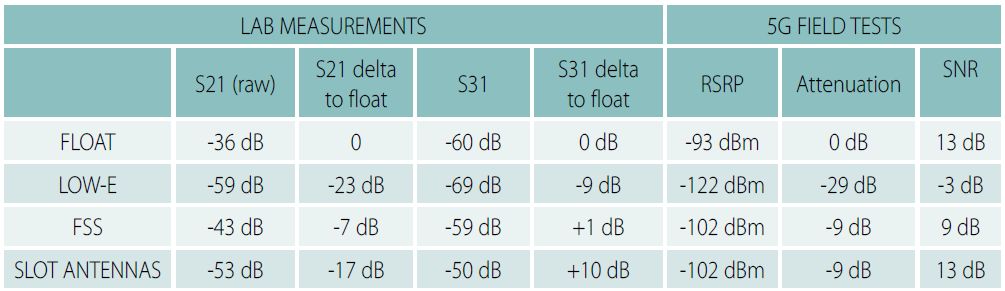
Table 1 shows the measurement results for both lab and field testing. First, the raw S-parameter results of the lab measurements at 3.5 GHz are reported for the direct ray (S21) and bent ray (S31). It is seen that the coated glass used in the measurements had a transmission loss attenuation of 23 dB for a directly propagated wave.
For the bent ray (S31), however, the reduction was only 9 dB, and this is due to the fact that with the reference of uncoated float glass this bent direction already had a propagation null, as one might expect from Fig. 6a. What is noteworthy is that the slot antenna shows 10 dB larger propagation for the bent ray (S31) on the side than the uncoated glass.
The FSS pane, on the other hand, remained approximately at the same level on the sideways penetrated ray than with float glass, confirming the simulated predictions of the scattering pattern shapes. For the direct ray (S21), the FSS showed 7 dB attenuated ray, and the slot antenna array showed 17 dB attenuated ray with respect to the reference with uncoated float glass.
The above results are well in line with the simulated predictions of Fig. 6a, Fig. 6b, and Fig. 8, where the slot array was shown to lower the maximal intensity for the direct ray by distributing the signal energy to the sides.
This was validated with structures that were designed to deliver approximately equal total power through the glass pane. Therefore, it becomes evident that the measurement method of only characterizing the directly propagated ray as in Fig. 9a with the S21 parameter is not sufficient for comparing solutions with different beam shapes.
For the 5G field measurements, the metal chamber was positioned approximately 500 meters away from the base station, and the glass face was pointed away from line of sight to the base station.
Between the chamber and the base station, there was a concrete bridge as seen in Fig. 9c. There were also multiple sources of reflections around the test location, so that all measurements were done with reflected signals.
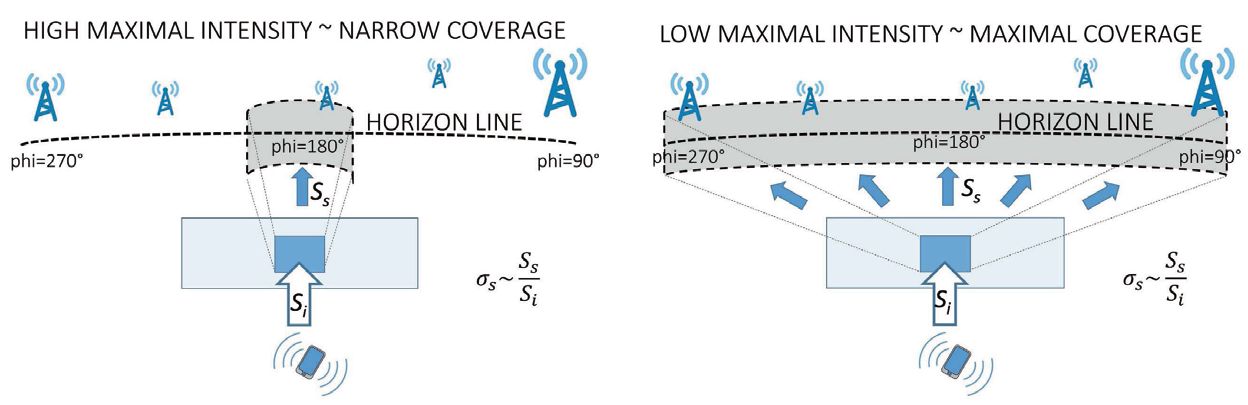
Fig. 7. Illustration of the scattered field distribution over the horizon with high (left) and low (right) directivity. Lowered directivity may be used to enhance the probability of reaching multiple outdoor base stations of unknown locations
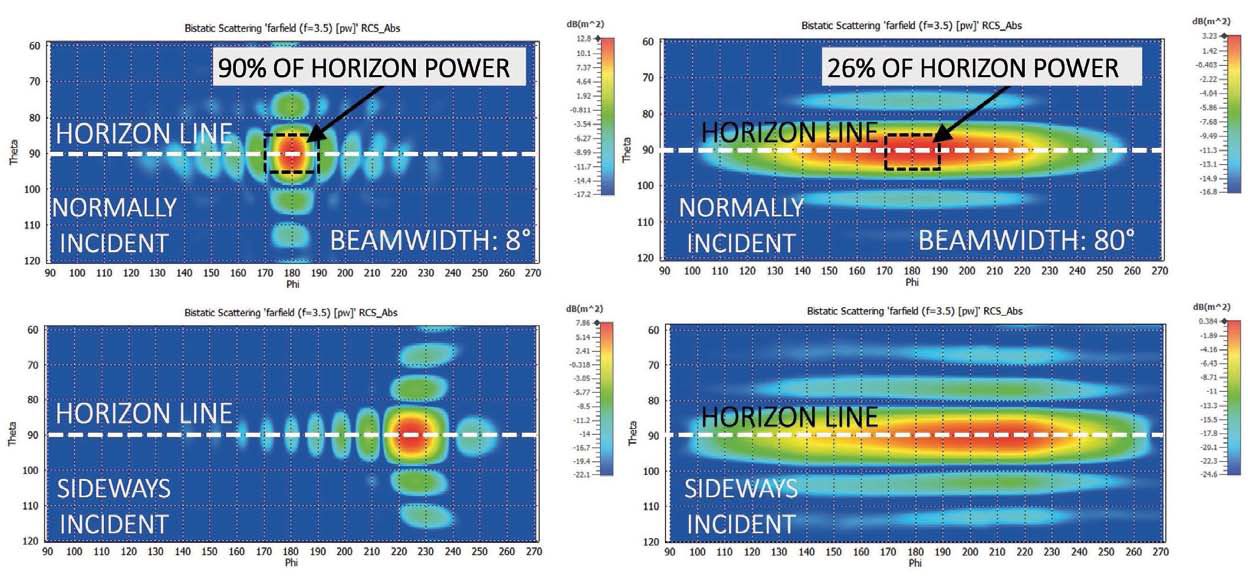
Fig. 8. Left: 2D scattering map of the FSS grid over the horizon. Right: Left: 2D scattering map of the slot antenna array over the horizon. T op row shows the scattering with direct incidence and bottom row shows the scattering with indirect incidence. With FSS, an azimuth angle of 20° covers 90% of all the power delivered to the horizon, and with the slot antenna array, the same solid angle contains 26% of the respective power
The maximum speed of the 5G terminal used was around 400 Mb/s as seen from Fig. 1a. The maximum speeds were reached in locations where the test chamber was close to the base station.
At the test location of interest, i.e. at 500 m distance, the measured signal strength was -93 dBm through the uncoated float glass. Therefore, the operational region was roughly in the middle of the measured speed chart of Fig. 1a. At those signal power levels, the reachable speeds with the terminal were around 200 Mbps.
Table 1 shows that the 5G terminal reported similar attenuation levels for the FSS grid and for the slot antenna array, despite the major differences in the physical receiving areas of the two solutions.
The 5G terminal reported 9 dB attenuation for the 3.5 GHz signal with both the FSS and the slot antenna array, which suggests that the characterization of the total transmitted power through the 3D hemisphere provides more reliable point of reference for comparing different solutions and for the prediction of the end user experience.
Discussion and future studies The study that was carried out suggests that from the end user viewpoint the total transmitted power and the beamwidth in the horizontal plane are the fundamental properties to be characterized in signal transparent construction supplies. These properties can show major differences between different solutions.
The traditional transmission loss measurement method with two face-to-face antennas relies on the assumption that majority of the signal energy propagates as a direct ray. The example with a slot antenna array, however, showed that when a structure is diffractive, much of the penetrated signal power is redirected away from the direction of the direct ray.
When signal transparent construction supplies are being characterized, both the distribution of the signal power over the transmitted space and the amount of total transmitted power needs to be characterized.
Bistatic radar cross section was shown to be a usable tool in the analysis of different signal transparent construction supplies. This may be used to analyze the coverage efficiency in the horizon, but also to estimate the received power levels at the horizon when combined with the radar equation.
Future studies include analysis of glass panes as equivalent areas, where the equivalent area being determined from the total 3D power integrals over the transmitted hemisphere.
When the total transmitted powers of different solutions are referenced to equivalent areas (i.e. square meters) of open holes that deliver equal powers, architects could have handy tools to specify signal penetration for facades with intuitive means of equivalently sized holes in the wall.
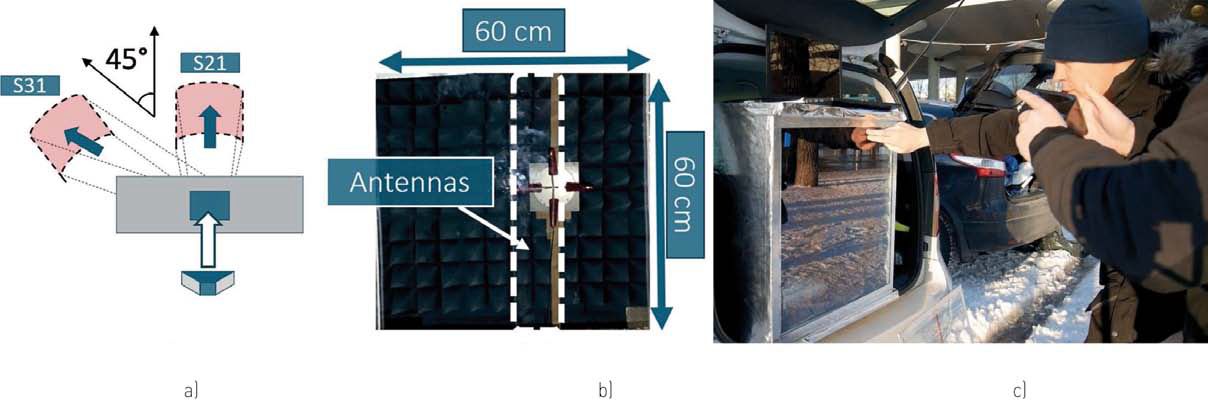
Fig. 9. Setup for glass measurements (a), and a glass sample with slot antennas in an anechoic chamber (b), and a picture of the 5G field test with the same glass (c)
Table 1: Measurement results from the anechoic chamber and 5G field trials
Conclusions
Penetration of a 3.5 GHz signal through different glass solutions were analyzed by simulations and measurements. The total power delivered through the glass panes were computed, and this was compared with VNA measurements.
It was shown that the direct ray measurement with two face- to-face antennas fails to characterize the properties of different solutions when the scattering patterns are different.
The computation of the total power delivered through the tested apertures provided more realistic predictions for the field performance than a direct ray testing with VNA. Bistatic RCS was used to analyze the scattering patterns with two different angles for the incident wave. It was seen that the geometry of the aperture has a dominant role in the scattering properties.
Directive geometry was seen to concentrate the energy of the penetrated signal to a narrow beam. The 3 dB beamwidth of the bistatic RCS was 8° for the open reference aperture, 8° for the coated glass with FSS grid, and 80° for the coated glass with slot antenna array.
Field testing for different solutions showed similar received power levels with a commercial 5G router. The compared structures were designed for similar transmitted total power levels.
(...)
The article is based on the lecture presented at the GLASS PERFORMANCE DAYS 2017 Conference, which took place on June 26-28, 2019 in Tampere, Finland
Juha Lilja
StealthCase Oy
References
[1] G. I. Kiani, A. Karlsson, L. Olsson, K. P. Esselle, ”Glass Characterization for Designing Frequency Selective Surfaces to Improve Transmission through Energy Saving Glass Windows”, APMC, 11-14 Dec. 2007
[2] G. I. Kiani, K. P. Esselle, A. Karlsson, K. P. Esselle, ”Transmission of infrared and visible wavelengths through energy-saving glass due to etching of frequency-selective surfaces”, IET Microw. Antennas Propag., Vol. 4, Iss. 7, pp. 955-961, 2010
[3] S. Sohail, G. I. Kiani, K. P. Esselle, ”Enhancing RF/microwave efficient transmission through energy saving glass windows using Frequency Selective surface”, APSURSI, 3-8 July 2011
[4] A. K. Dominek, L. Peters JR., “RCS measurements of small circular holes”, IEEE transactions on antennas and propagation, Vol. 36, No. 10, Oct. 1988.
patrz też:
- Szkło umożliwiające korzystanie z telefonii komórkowej dzięki uszlachetnianiu laserem , Świat Szkła 02/2020
- Efektywność energetyczna jest trucizną dla łączności wewnątrz pomieszczeń , Świat Szkła 9/2019
- Mobile-Friendly Glass – Comparing Solutions from the End User Viewpoint , Juha Lilja, Świat Szkła 09/2019
- Grupa HEGLA zaprezentuje się na targach VITRUM, podkreślając aspekt wydajności , Świat Szkła 09/2019
- Uszlachetnianie szkła laserem na miarę indywidualnych potrzeb , Carsten Koch, Świat Szkła 02/2019
- Znakowanie laserowe: delikatne na szkle, trwałe, czytelne , Carsten Koch, Świat Szkła Wydanie 06/2018
- Grawerunki laserowe chronią ptaki przed śmiercią , Thomas Rainer, Świat Szkła 08/2016

Całość artykułu w wydaniu drukowanym i elektronicznym
Inne artykuły o podobnej tematyce patrz Serwisy Tematyczne
Więcej informacji: Świat Szkła 9/2019